

4.2% monthly churn.
It’s on the dashboard. It goes into the board deck. Everyone agrees it should be lower.
Nobody agrees on what to do about it.
Product wants to rebuild onboarding. Customer success wants more check-in calls. Marketing wants a win-back campaign. Finance wants a discount for annual plans.
All four could be right. All four could be wasting a quarter.
The churn rate can’t settle it, because it’s an average. It tells you how many customers you lose. It doesn’t tell you when the relationship breaks, and the “when” is what points to the fix. Cohort retention analysis does.
In No. 0 I said that the same churn rate can hide completely different problems. This one is the practical follow-up: how to find out which problem you have, with one table, in an afternoon.
In short
Cohort retention analysis groups customers by when they signed up (or by channel, plan or campaign) and tracks how many are still active over time. It shows when customers leave, which a churn rate can’t.
The shape of the retention curve points to the likely cause, and to the team that owns the fix: a month-one cliff, slow erosion, a renewal cliff, or one broken cohort each call for a different first move.
The shape is a pointer, not proof. Confirm it with behavior data, test one intervention against a holdout, and measure the next cohort.
Why the average hides the problem
A churn rate mixes customers who signed up last week with customers who have paid you for two years.
They are at completely different stages of the relationship. New customers are still deciding whether the product works for them. Mature customers are deciding whether it’s still worth the invoice.
Churn is an outcome, not a cause. Behind every cancellation is a moment where the customer stopped getting value. Averaging every customer together erases the one piece of information that helps you find that moment: timing.
The Drop-Off Map: cohort retention analysis in four steps
The Drop-Off Map is a simple routine with four steps:
Build the cohort table.
Remove failed payments first.
Read the shape, and pick the first move.
Find the behavior behind the drop, then test one change.
Step 1 — Build the cohort table
A cohort is a group of customers who signed up in the same month. A cohort retention table shows, for each cohort, the share still active one month, two months, three months after signup.
Signup date is the most common way to group customers, not the only one. You can also build cohorts by acquisition channel, plan or offer, and compare their curves. Start with time, because it shows when customers leave. The other cuts show who leaves, and they come back in Step 3.
Illustrative numbers:
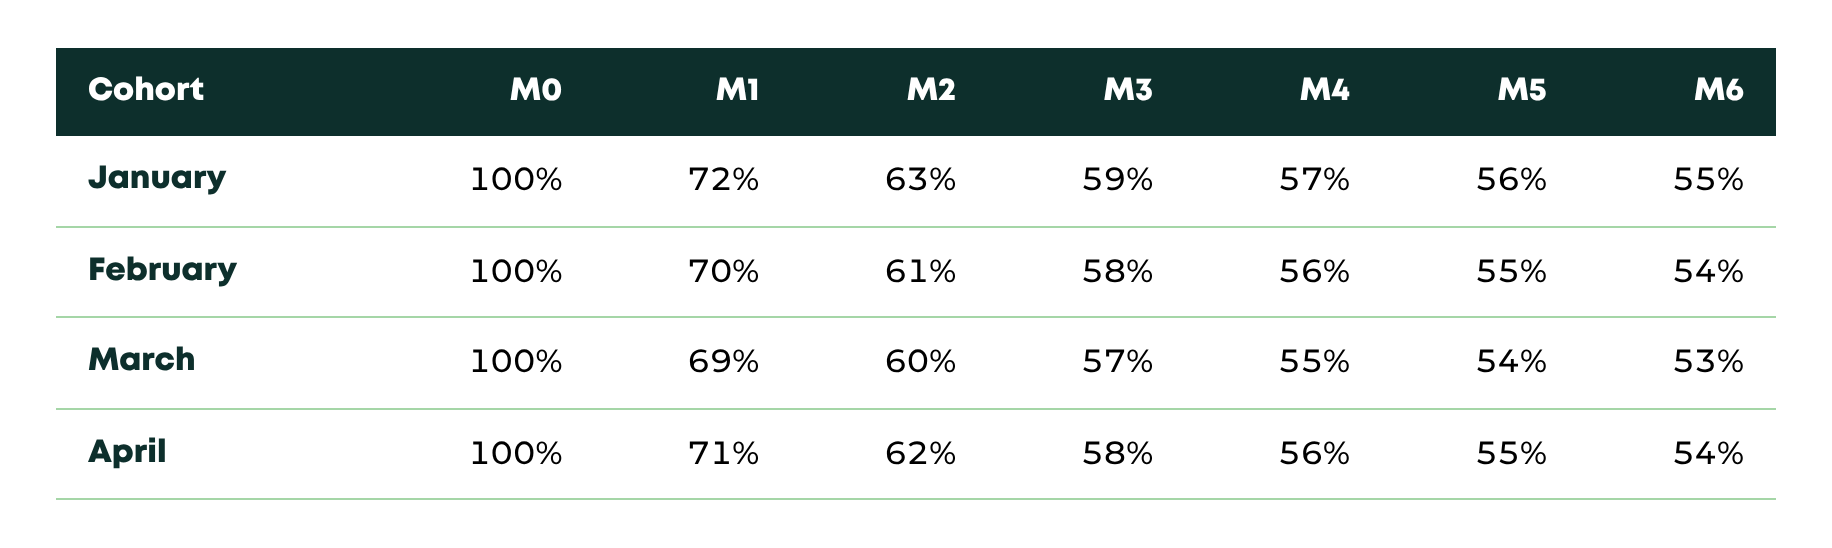
Read it across, not down. In every cohort, roughly 30% of customers are gone by month one. After that, the curve almost flattens.
That’s the signal. Most of the damage happens in the first 30 days.
Small numbers? With fewer than ~50–100 signups a month, monthly cohorts are too noisy to read. Group them by quarter, or read your last 10 cancellations one by one before building anything.
If your billing data sits in a database, the query at the bottom builds the table for you.
This counts customers, not revenue (logo churn). Run it again weighted by MRR when you want revenue churn. The two can tell different stories.
Step 2 — Remove failed payments first
Before you blame onboarding, check how many of those early cancellations were never a decision.
Involuntary churn is when a subscription ends because a payment fails: an expired card, insufficient funds, a declined charge. Voluntary churn is when the customer chooses to leave.
A month-one cliff can be either. The fixes have nothing in common: one is a billing problem, the other is a product problem.
Many billing tools record why a subscription ended. If yours does, split the table in two, voluntary and involuntary, and look at the voluntary one for the rest of this routine.
Step 3 — Read the shape, and pick the first move
Here’s the core of the strategy. The timing of churn tells you where to look first, and it usually tells you which team should own the problem.
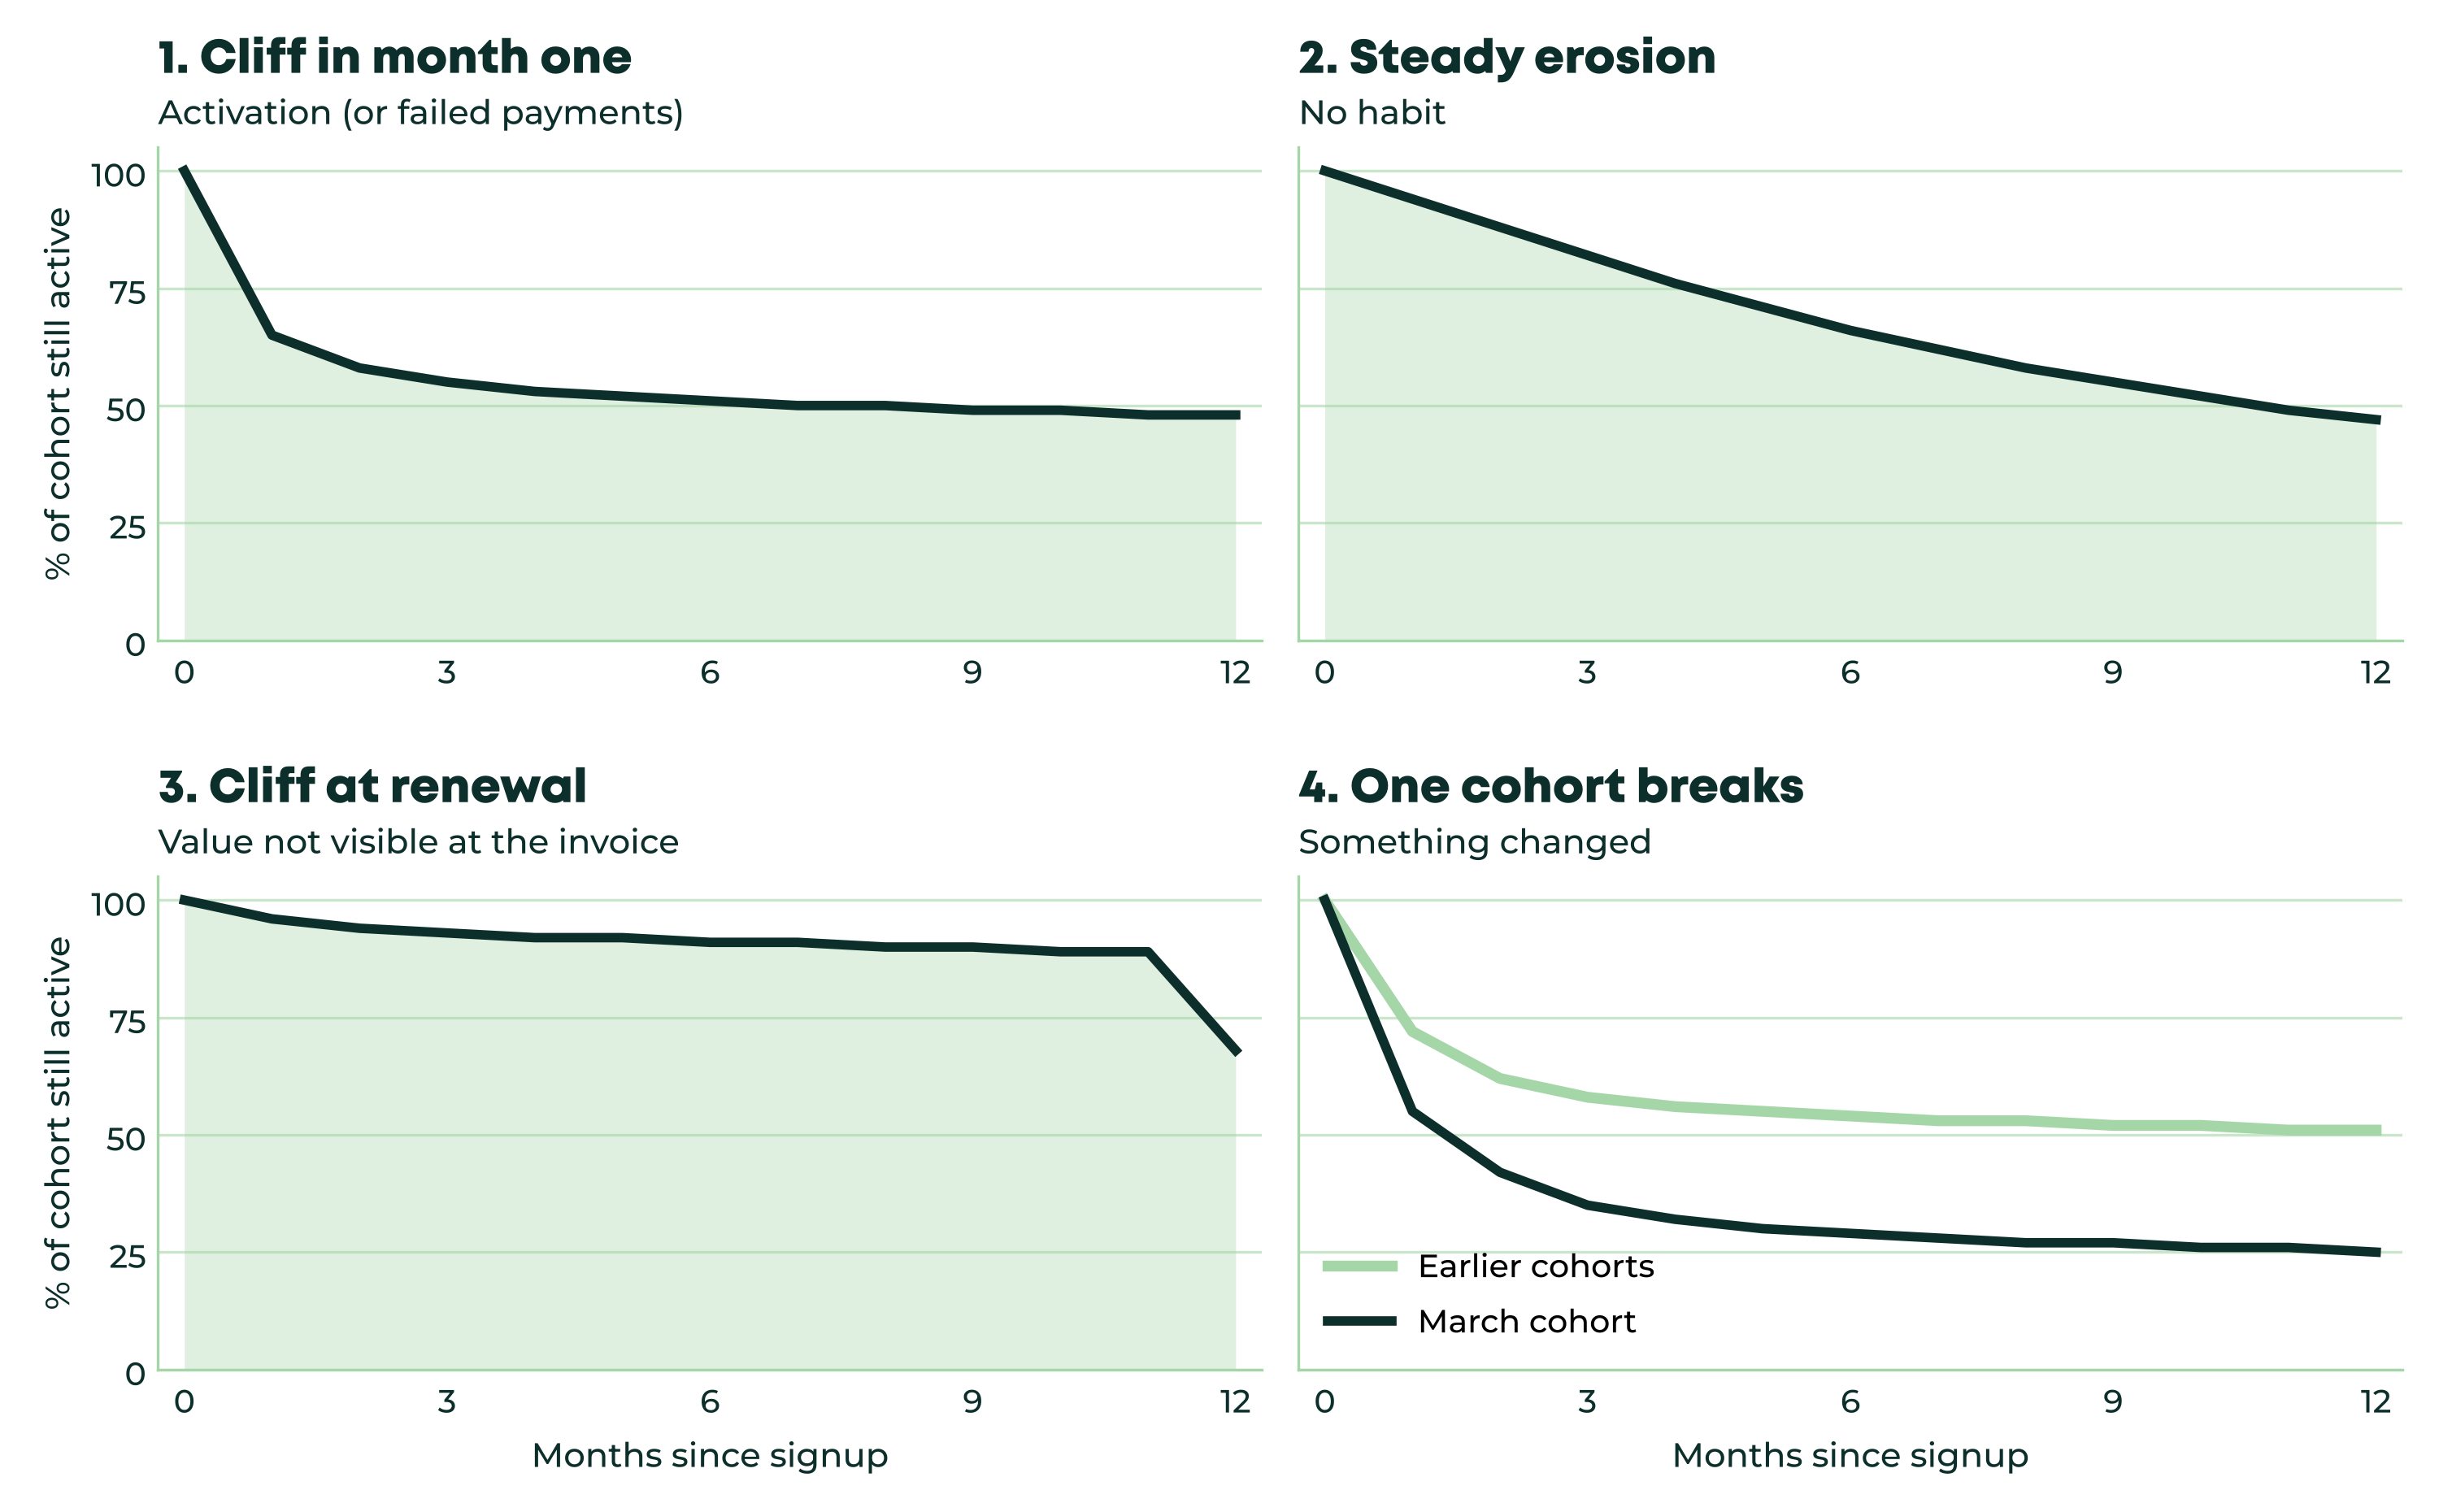
The chart shows four curves. In the first, a third of customers vanish in month one, then the curve flattens. In the second, a few leave every month, with no single bad moment. In the third, everything looks healthy until month twelve, then a wall. In the fourth, one cohort falls far below all the others.
Save this list. It’s the one I’d keep next to the cohort report:
Cliff in month one
What it usually points to: Customers never reached value
Look first at: Time to the first key action; onboarding completion
First move this week: Count the steps between signup and first value, and cut one
Usually owned by: Product
Steady erosion, no cliff
What it usually points to: It solved a first problem but never became a habit
Look first at: How often customers repeat the key action each week
First move this week: Add a reason to come back that doesn’t rely on memory (a digest, an alert, a scheduled report)
Usually owned by: Product + CS
Cliff at renewal (annual plans)
What it usually points to: Value isn’t visible when the invoice arrives
Look first at: Usage in the 60–90 days before renewal; did the buyer leave the company?
First move this week: Send a value recap in the customer’s own numbers 60–90 days before renewal
Usually owned by: Customer success
One cohort breaks
What it usually points to: Something changed: channel, targeting, price, release
Look first at: That cohort’s channel and plan mix vs. the others
First move this week: Find the campaign or channel behind it, and fix or pause it
Usually owned by: Marketing / Sales
Smooth average, no clear moment
What it usually points to: The average is hiding segments that behave very differently
Look first at: Retention split by plan, channel, company size, use case
First move this week: Don’t fix anything yet: split the curve first
Usually owned by: Leadership / RevOps
The last one is not a shape. It’s the case where the average looks smooth precisely because it blends very different customers. The fix is to stop looking at one curve.
A word of caution. A month-one cliff is consistent with an activation problem. It isn’t proof of one. The shape tells you where to look. The next step tells you what’s actually there.
Step 4 — Find the behavior behind the drop, then test one change
Take the month-one cliff. Split customers into two groups: those who left before month two, and those who stayed. Then compare what they did in their first two weeks.
Illustrative numbers:
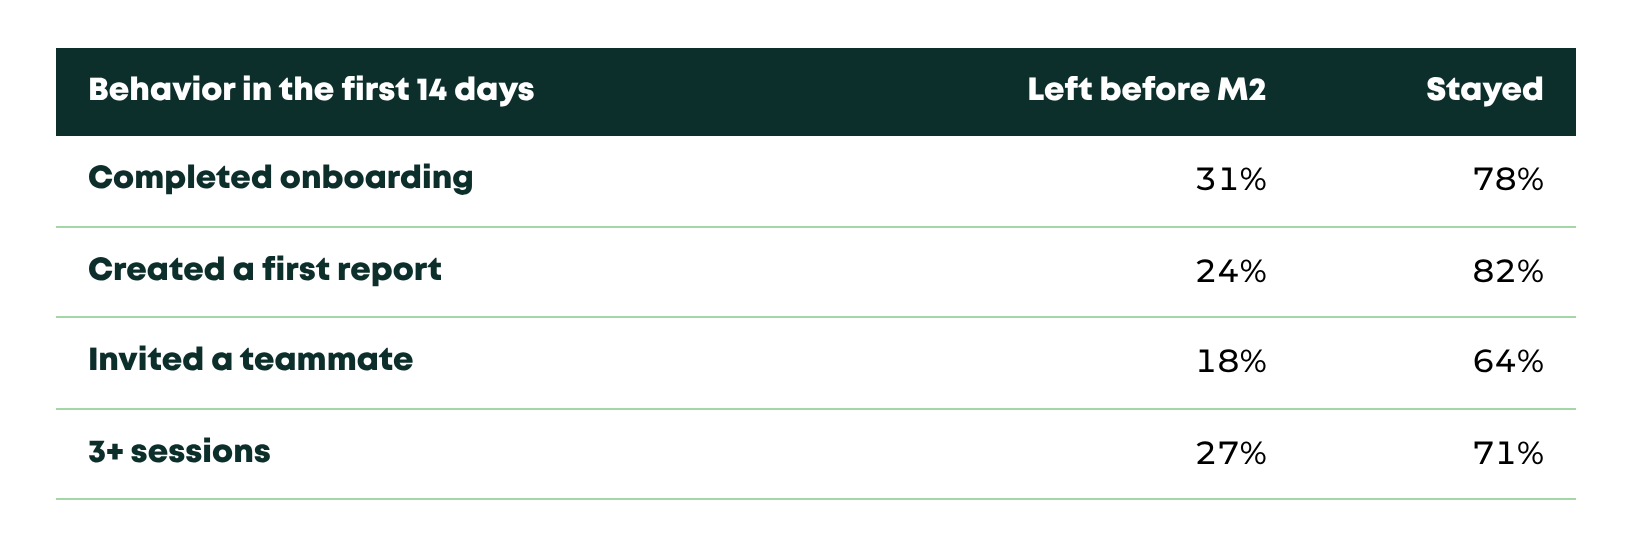
In plain words: customers who stayed were more than three times as likely to have created a first report.
Every product has an action like this. I call it the value event: the first moment a customer gets the result they signed up for. Creating a report, connecting an integration, sending a first campaign.
This is still correlation. Customers who were already more motivated may simply do more of everything. So treat the value event as a hypothesis, and test it:
Hypothesis: customers who don’t create a first report in week one never form the habit.
Intervention: guide every new customer toward the first report, and send a specific nudge on day 5 to anyone who hasn’t done it. Not a generic “how’s it going?” email.
Test: randomly hold back 10–20% of new signups from the nudge.
Measure: compare month-one retention between the two groups.
How to measure impact
The tempting move is to compare the cohorts before the change with the cohorts after it. Don’t rely on that alone.
Cohorts differ for many reasons: season, acquisition channel, pricing, a sales push at quarter end. A better March might have nothing to do with your nudge.
A holdout fixes this. Same month, same channels, same product. The only difference is the intervention.
With a few hundred signups a month, give it two or three cohorts before trusting a difference of a few points.
What it’s worth
Illustrative calculation:
A SaaS adds 200 customers a month at $100 MRR each.
Month-one retention goes from 70% to 78%. That’s 16 more customers per cohort past the first month.
If those customers then behave like everyone else (in the table above, about 76% of month-one survivors are still there at month six), that’s about 12 extra customers per cohort at month six.
12 × $100 = $1,200 MRR per cohort that would otherwise have been lost.
After twelve cohorts, that adds up to roughly $14,000 MRR, about $170,000 ARR, from one change in week one.
The formula is simple: extra customers retained × the share who stay afterwards × MRR per customer. Put your own numbers in.
The big assumption is that the customers you save behave like the ones who stayed on their own. That’s exactly what the holdout checks.
Your Monday checklist
Build the cohort retention table for the last 12 months.
Split out failed payments and look at voluntary churn only.
Name your shape using the list above, and the team that owns it.
Pick one candidate value event and compare churned vs. retained customers on it.
Design one intervention with a holdout group.
Your churn rate tells you how many customers you lose.
Your retention curve tells you when the relationship breaks.
And the “when” tells you what to fix first.
♻️ Keep customers longer.
Before you go: what does your month-one drop look like? Hit reply and tell me. I read every answer.
Antonio
Appendix: the query
It assumes one row per customer with a start date and an end date (empty while the customer is still active):
-- subscriptions(customer_id, start_date, end_date); end_date is NULL while active
-- One row per customer. Postgres syntax.
WITH base AS (
  SELECT customer_id, start_date, end_date,
         date_trunc('month', start_date)::date AS cohort
  FROM subscriptions
)
SELECT b.cohort,
       m AS month_number,
       ROUND(100.0 * AVG(CASE
         WHEN b.end_date IS NULL
           OR b.end_date > b.start_date + make_interval(months => m)
         THEN 1 ELSE 0 END), 1) AS pct_still_active
FROM base b
CROSS JOIN generate_series(0, 12) AS m
-- keep only months that every customer in the cohort has fully reached
WHERE b.cohort + make_interval(months => m + 1) <= date_trunc('month', current_date)
GROUP BY b.cohort, m
ORDER BY b.cohort, m;
In plain words: for each signup month, and for each month after it, the query counts the share of customers who hadn’t cancelled yet.